

Your sales report says Rs 50 lakh this month. But your bank balance says Rs 2 lakh. Sound familiar?
This gap between revenue and real profit is where most MSME business owners get stuck. They work harder, sell more, but the cash never quite shows up.
The problem isn’t effort. It’s the absence of financial KPIs, the numbers that actually tell you if your business is growing or slowly bleeding.
Financial KPIs (Key Performance Indicators) are specific, measurable numbers that reveal the truth about your business’s financial health.
They go beyond just revenue and tell you about profitability, cash flow, efficiency, and risk.
And in India, where MSMEs contribute over 30% of the GDP and employ around 11 crore people, getting these numbers right isn’t optional. It’s survival.
Before exploring specific metrics, it’s important to understand what financial KPIs actually represent.
Financial KPIs are measurable indicators that evaluate how well a company is performing financially. They help businesses track revenue, profitability, expenses, and operational efficiency.
These finance KPI metrics are commonly used by executives, finance teams, and investors to measure business success.
Good KPIs must be:
This is why most organizations focus on finance KPIs measurable through reliable financial data.
Tracking the right financial KPIs for business helps leaders make better strategic decisions.
Key benefits include:
Without proper financial metrics, businesses may struggle to understand their real performance.
Here’s your practical finance KPI list. The numbers that actually drive decisions.
These are finance KPIs measurable and relevant across industries, whether you run a retail store, a service business, or a manufacturing unit.
Let’s break down each one with simple formulas and what they mean for your business.
Formula: (Revenue – Cost of Goods Sold) ÷ Revenue × 100
This tells you how much profit you keep from each rupee of sales after covering direct costs.
If your gross margin is 30%, you’re keeping Rs 30 from every Rs 100 in sales before overhead.
Example: Priya’s bakery in Pune. Revenue: Rs 10,00,000. Costs: Rs 6,50,000. Gross Margin = (10,00,000 – 6,50,000) ÷ 10,00,000 × 100 = 35%. She found birthday cakes had 50% margin, cookies only 15%. She dropped cookies and doubled down on cakes.
Formula: (Net Profit ÷ Total Revenue) × 100
This is the final truth. After rent, salaries, taxes, and interest, how much is actually left? A healthy MSME should aim for at least 10–15% net margin.
Example: Ramesh’s garment business in Surat. Revenue: Rs 10,00,000. All expenses (fabric, rent, salaries, taxes, interest, transport): Rs 9,00,000. Net Profit = Rs 1,00,000. Net Margin = 10%. His competitor runs at 18%. The difference? Ramesh was paying Rs 30,000/month on a loan he could have closed 6 months ago.
This shows how much cash your daily business operations generate. Strong sales mean nothing if cash is stuck in receivables or inventory. Track this monthly.
Formula: Current Assets ÷ Current Liabilities
Can you pay what you owe in the next 12 months? A ratio above 1.5 is healthy. Below 1 means trouble is coming.
Example: Meena’s restaurant chain in Chennai. Current assets (cash + Swiggy/Zomato dues + inventory): Rs 9,00,000. Current liabilities: Rs 6,00,000. Current Ratio = 1.5. Comfortable. But during monsoon, it dropped to 0.8 — she couldn’t pay vegetable suppliers. Now she tracks it weekly.
Formula: Net Credit Sales ÷ Average Accounts Receivable
This measures how fast you’re collecting money from customers. If receivables stretch beyond 60 days, you’re essentially funding your customers’ business with your money.
Example: Sunil’s packaging business in Mumbai. Annual credit sales: Rs 60,00,000. Average receivables: Rs 10,00,000. AR Turnover = 6 times/year = collections every 60 days. But his suppliers expect payment in 30 days. He was funding his clients’ business for a full month from his own pocket. He renegotiated and brought it down to 45 days.
Formula: Total Debt ÷ Total Equity
How much of your business is funded by debt versus your own capital? If this ratio is above 2, the risk is high. You’re working to pay interest, not build wealth.
Example: Anil’s construction supply business in Jaipur. Total debt: Rs 25,00,000. Owner’s equity: Rs 20,00,000. Debt-to-Equity = 1.25. Manageable. A friend urged him to take Rs 20L more for a second warehouse. That would push the ratio to 2.25, red zone. He waited until profits built up equity first.
Formula: (Current Period Revenue – Previous Period Revenue) ÷ Previous Period Revenue × 100
Is your business growing? Compare quarter to quarter or year to year. Growth without margins is dangerous. Growth with healthy margins is the goal.
Example: Kavita’s salon chain in Hyderabad. Last year: Rs 80,00,000. This year: Rs 96,00,000. Growth Rate = 20%. Impressive… until she checked margins. Net margin dropped from 14% to 9% because of new hires and heavy discounts. Revenue grew 20%, but profit actually fell. She now tracks both side by side.
Formula: Cost of Goods Sold ÷ Average Inventory
Slow-moving inventory is frozen cash. A low turnover means your money is sitting on shelves instead of working for you. This is one of the most critical financial KPI examples for manufacturing and retail.
Example: Vijay’s hardware store in Nagpur. COGS: Rs 48,00,000/year. Average inventory: Rs 8,00,000. Turnover = 6 times (stock turns every 2 months). But Rs 2,00,000 in imported fittings had been sitting untouched for 8 months. He ran a clearance sale, freed the cash, and bought fast-moving items. Turnover jumped to 8.
Formula: Net Income ÷ Total Assets
Are your assets (equipment, machinery, property) earning their keep? A low ROA may mean underutilised resources.
Example: Farhan’s printing press in Ahmedabad. Net income: Rs 12,00,000. Total assets: Rs 80,00,000. ROA = 15%. But one of his two machines sits idle 3 days a week. Filling that capacity could push income to Rs 18,00,000 and ROA to 22.5% with zero new investment. That idle machine costs him Rs 6,00,000/year.
Formula: (Current Assets – Inventory) ÷ Current Liabilities
This is the strictest test of liquidity. It excludes inventory and tells you: Can you survive a sudden cash crunch right now?
Example: Lakshmi’s textile business in Coimbatore. Current assets: Rs 9,00,000 (includes Rs 2,00,000 in slow-moving stock). Current liabilities: Rs 6,00,000. Current Ratio looks fine at 1.5. But Quick Ratio = (9,00,000 – 2,00,000) ÷ 6,00,000 = 1.17. Barely safe. The Quick Ratio exposed what the Current Ratio hid.
Formula: Net Operating Income ÷ Total Debt Service (EMI + Interest)
If you have loans or EMIs running, this is the KPI that tells you whether your business earns enough to comfortably service that debt. A DSCR below 1.25 means you’re in the danger zone. Your income barely covers your repayments.
For any MSME with bank loans, vehicle loans, or machinery finance, this is a non-negotiable number to track every single month.
Example: Rajendra’s auto parts factory in Ludhiana. Total EMIs + interest: Rs 3,00,000/month. Net operating income: Rs 5,00,000/month. DSCR = 1.67. Safe. But during a 2-month slump, income dropped to Rs 3,50,000 and DSCR fell to 1.17, dangerously close to not being able to pay EMIs. He now keeps a 2-month EMI reserve.
Here’s what changes when you start tracking these financial KPIs for business:
| Business Area | Without Financial KPIs | With Financial KPIs |
| Pricing Decisions | Based on gut feeling or competitor copying | Based on actual margins and cost data |
| Cash Flow | Surprises every month, always short | Predicted and planned, rarely caught off guard |
| Debt Management | Borrow when desperate, no strategy | Planned borrowing with clear debt-to-equity targets |
| Growth Planning | Expand based on excitement | Expand based on revenue growth rate and ROA data |
| Receivables | Chase payments reactively | Set collection targets, track turnover ratio |

If you’re a business owner who has a finance manager (or you’re thinking about hiring one), this section is for you. Finance manager key performance indicators are different from business-level KPIs. They focus on operational finance efficiency.
Here are practical finance manager KPI examples that help you measure whether your finance function is running well:
| Finance Manager KPI | What It Measures | Why It Matters for Business Owners |
| Days Sales Outstanding (DSO) | Average days to collect payment | Lower DSO = faster cash collection = better cash flow |
| Budget Variance | Actual spend vs planned budget | Keeps spending disciplined and predictable |
| Expense Ratio | Total expenses as % of revenue | Shows if overheads are eating into profits |
| Tax Compliance Rate | On-time filing of GST, TDS, IT | Avoids penalties and legal risk |
| Financial Close Time | Days to close monthly books | Faster close = faster decision-making |
| Accounts Payable Turnover | How fast you pay suppliers | Manages supplier relationships and cash outflow |
Manufacturing businesses have unique financial needs. Beyond the standard finance KPI list, financial KPIs for manufacturing include metrics that directly tie to production, inventory, and operational costs.
Here are the additional KPIs manufacturing business owners should track:
| Manufacturing KPI | Formula / How to Track | What It Reveals |
| Cost Per Unit | Total Production Cost ÷ Units Produced | Are you producing efficiently or bleeding cash per unit? |
| Inventory Days | Average Inventory ÷ COGS × 365 | How long does your stock sit before it sells? |
| Scrap & Waste Rate | Waste Cost ÷ Total Material Cost × 100 | How much raw material is being wasted? |
| Capacity Utilisation | Actual Output ÷ Maximum Possible Output × 100 | Are you using your machines and people fully? |
| Order-to-Cash Cycle | Days from order placement to payment received | Total time your money is locked in the process |
For manufacturing MSMEs, tracking these alongside the standard financial metrics and KPIs gives you a complete picture. You’ll spot inefficiencies early before they become losses.
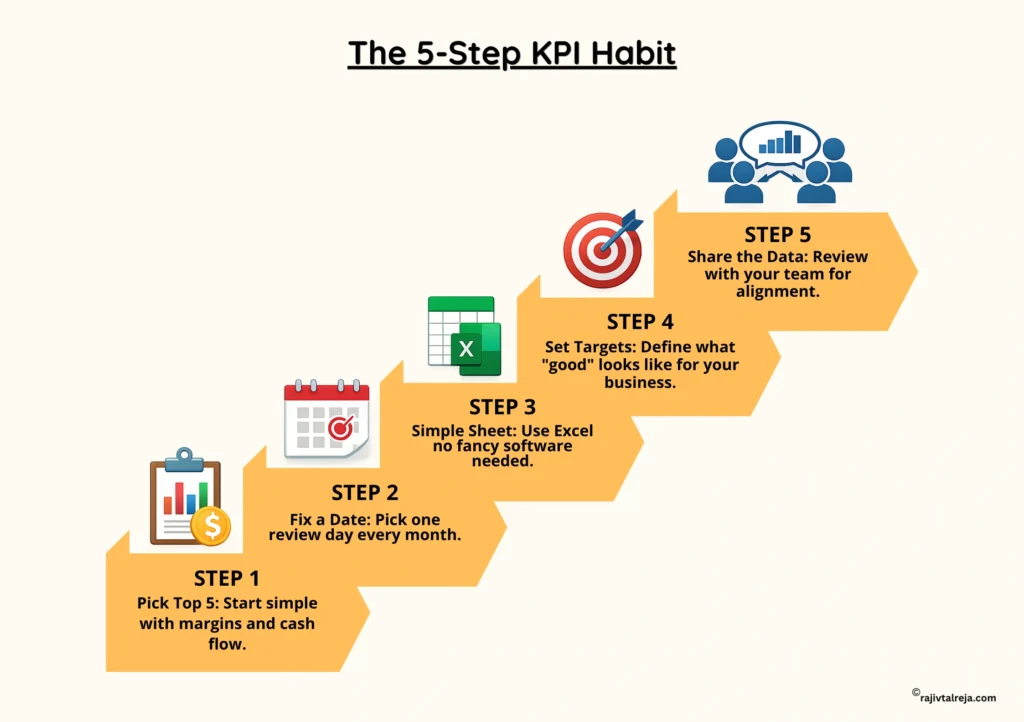
You don’t need expensive software to begin. What you need is a system and a habit. Here’s a simple way to get started:
Step 1: Pick your top 5 KPIs. If you’re just starting, go with Gross Margin, Net Margin, Operating Cash Flow, Current Ratio, and Revenue Growth.
Step 2: Set a monthly review date. Every month, on the same date, sit down for 30 minutes and look at these numbers. No excuses.
Step 3: Use a simple spreadsheet. You can track all your finance KPI metrics in a basic Excel or Google Sheet. No fancy dashboard needed in the beginning.
Step 4: Set targets. Each KPI should have a goal. For example: Gross Margin above 35%. Current Ratio above 1.5. DSO below 45 days.
Step 5: Review with your team. Share the numbers with your finance manager and key team members. When everyone sees the same numbers, decisions get aligned.
Teams that get this right tend to make fewer reactive decisions. They plan better, price smarter, and grow more sustainably.
Tracking the right financial KPIs is essential for understanding business performance and making informed decisions.
When you know your margins, your cash position, and your collection speed, you stop guessing. You start leading. And your business starts working for you, not the other way around.
Pick your KPIs. Set your targets. Review them every single month. That’s how businesses grow with clarity and confidence.
For more such business insights, explore our blog page and stay ahead in business strategy, finance, and leadership.

The five types are profitability, liquidity, efficiency, leverage, and growth KPIs.
Operating cash flow. Revenue and profit matter, but cash flow decides whether you can pay salaries, suppliers, and EMIs this month. Without it, even profitable businesses fail.
Monthly, at a minimum. Set a fixed date each month to review your top 5 KPIs. Quarterly deep-dives with your finance manager or accountant add extra clarity.
All KPIs are metrics, but not all metrics are KPIs. Financial metrics are any measurable numbers. KPIs are the critical few metrics tied directly to your business goals.
Yes. A simple Excel or Google Sheets file with your top 5–10 KPIs, updated monthly, is enough to start. Upgrade to software only when your business complexity demands it.
Key examples of KPIs in finance for manufacturing include cost per unit, inventory turnover, scrap rate, capacity utilisation, and order-to-cash cycle time.
Business owner KPIs focus on overall profitability and growth. Finance manager key performance indicators focus on operational finance efficiency, like DSO, budget variance, and compliance rates.
It varies by industry, but 30–50% is a healthy range for most MSMEs. Service businesses tend to have higher margins. Product businesses depend on sourcing and production efficiency.
Profit is calculated. Cash flow is real. You can show a profit on paper, but still run out of money if receivables are delayed and expenses keep flowing. Cash keeps the business alive.


