Ever feel like you’re flying blind, making critical business decisions based on a combination of experience, market sense, and pure gut feeling?
Your gut feeling is a valuable tool, but in today’s data-driven world, relying on it alone is like navigating a storm without a compass.
What if you could pair that intuition with facts, turning your raw business data from a confusing mess into your most powerful strategy? This is what Business Intelligence (BI) offers.
This blog will serve as your introduction to business intelligence, showing you exactly how to harness business intelligence to make smarter, faster decisions that drive real growth for your business.
To truly understand what business intelligence is, we must first explore the meaning of business intelligence in a practical sense.
Are spreadsheets and scattered reports making your head spin?
Don’t worry, you’re not the only one.
Lots of business owners find it tough to see the whole picture behind their numbers. Business Intelligence is here to clear things up, turning your messy data into easy-to-understand, useful insights.
Business Intelligence (BI) uses tech to gather, examine, and show your company’s data in an easy-to-grasp way.
BI is a real-time dashboard for your entire company and gives you a live, consolidated view of your business’s health, tracking key metrics like sales, cash flow, and customer satisfaction.
It helps you understand what your data is truly telling you.
The Business Intelligence happens in a simple, four-step process that modern tools automate –
To start, Business Intelligence tools pull data from all your different systems, your point-of-sale (POS) terminal, accounting software (like QuickBooks or Xero), CRM, website analytics, and even those key spreadsheets.
This process, often called ETL (Extract, Transform, Load), brings everything together, cleans it up to fix mistakes, and arranges it in one central spot. This creates a single trustworthy source of business intelligence data.
After you organise your data, BI software looks for patterns, trends, and unusual points.
Like…
BI presents findings visually through charts, graphs, and maps instead of drowning you in raw numbers.
These business intelligence charts make complex information instantly understandable, allowing you to see important and repetitive trends at a glance.
The final, most important step is using these insights to take action.
With a clear picture of current and past data, you can make smarter choices on the spot, like moving your marketing money to a channel that works better or launching a new product to meet a customer need you’ve just spotted.
This is how data turns into real business value through effective business intelligence.
The main outputs you’ll work with are dashboards (your quick-look command centre), reports (deeper automatic summaries), and data visualisations (the charts and graphs that tell the story).

In today’s business world, how can you get ahead when you’re up against large companies?
The answer isn’t to spend more. It’s about thinking smarter. Understanding the importance of business intelligence is the first step.
Business Intelligence evens the odds, giving your MSME the ability to work with the same insight and flexibility as your biggest rivals.
When you analyse market shifts, how customers act, and what your competitors do, you can change your strategy quicker, find gaps in the market that others miss, and come up with new ideas where they count most.
This form of competitive intelligence is a core benefit of a well-implemented business intelligence system.
BI offers quick wins by spotting and fixing operational issues. When you automate data gathering and review, you cut out hours of hands-on work, letting your team zero in on growth.
For a small or medium business, this means big savings in areas like –
Business intelligence pulls down data walls to show a complete picture of your customer, joining everything from what they buy to how they interact with service. This full view lets you –
Business intelligence dashboards give you a live, complete look at your money situation, keeping tabs on income, costs, profit margins, and cash flow. This clarity enables –
BI shifts your whole organisation from responding to issues to foreseeing them ahead of time, giving every team member the power to make smarter, data-driven choices.
This shows how crucial business intelligence and analytics are for modern companies.

Knowing the difference between business intelligence and business analytics is important to investing in the right solution for your business right now.
The main difference is the question they answer.
It tells you your current speed (what’s happening now) and shows you the road you’ve already travelled (what happened).
It not only shows you the map but also analyzes traffic data to predict future jams and recommend the fastest route to your destination.
For an MSME business, business intelligence is the key first step.
Your sales, finance, and operations teams all use the same playbook and work with identical numbers. It breaks down the “data silos” that naturally form as a business grows, creating a single source of truth.
When everyone can access this combined data, each department benefits –
Look deeper than basic metrics.
Find out the real return on your marketing efforts, grasp customer buying patterns to sharpen your approach, and spot your best-selling items to focus on what succeeds. Effective competitive intelligence helps you understand how your marketing stacks up against others.
Take a live, up-to-the-minute look at your company’s money matters.
Review cash flow, profit margins, and expenses to make the right money choices that boost your bottom line.
Make your core functions run smoothly.
Better inventory control cuts storage costs, spots supply chain issues before they blow up, and gets rid of waste to increase productivity.
Data can help even small teams.
Observe how productive employees are and how often they leave. This lets you hire better, spot where training’s needed, and create better staff schedules.
You’re probably sitting on a goldmine of valuable data without even realising it.
A business intelligence system is as good as the information it gets, and your day-to-day work is already creating what it needs. All of this is considered business intelligence data.
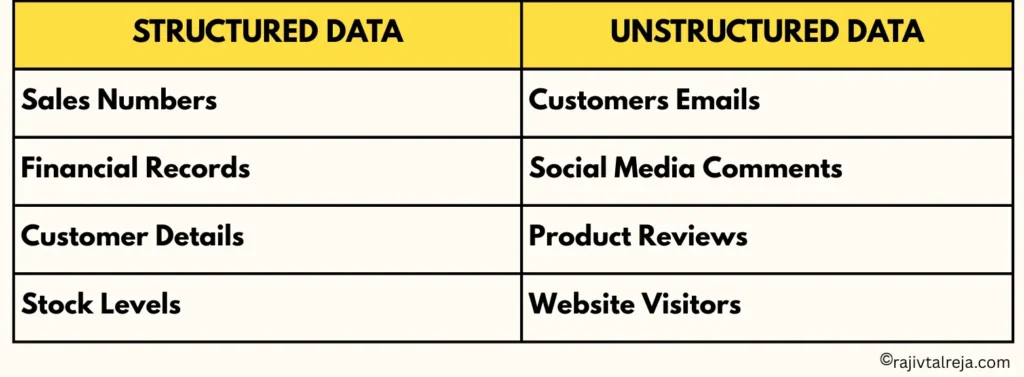
The easiest and most common type of data for BI is structured data. This is information that’s highly organized. Here are some examples –
As you grow, you also generate less organized but incredibly rich data –
This type of information doesn’t have a set format.
For example –
When you analyze this data, you can gain valuable insights into how customers feel.
This falls in between, containing tags that separate elements.
For example, data from website logs or emails with a defined sender/recipient but a free-form body.
Business Intelligence can handle huge amounts of data, but you don’t need “Big Data” to get great value from BI.
The basic ideas of gathering, studying, and showing data work just as well with the smaller, easier-to-manage datasets that most MSME businesses use.
So, what does a BI tool actually do?
Let’s explore key features of business intelligence that transform raw numbers into winning plans. There are also different styles of business intelligence, such as tactical BI for daily operations and strategic BI for long-term planning, each with its own focus.
Data visualization turns complex datasets into easy-to-understand charts and graphs that show trends a spreadsheet can’t.
To make this practical, here are specific BI use cases for different MSME sectors –
| MSME Sector | Key Business Question | BI Application / Measure | Possible Outcome |
| Retail (Physical Store) | What items do customers often buy together? | Shopping cart review, product connection dashboard | Guide product placement, design package deals, and boost average sale value. |
| E-commerce | Where do customers leave during the checkout process? | Website conversion funnel analysis | Improve the checkout process to cut cart abandonment and boost sales. |
| Restaurant/Café | When are we busiest, and do we have enough staff? | Sales data analysis | Improve staff schedules to cut costs OR improve service during peak hours. |
| Manufacturing | Which part of our production line slows down the most? | Operational efficiency dashboard, cycle time analysis. | Find and fix bottlenecks to increase production output and shorten lead times. |
Implementing the right Business Intelligence tool can feel overwhelming, but it doesn’t have to be.
Let’s break down the options to find the perfect fit for your MSME’s budget, technical skills, and business needs.
The best choice for nearly every MSME today is a Cloud-Based (SaaS) solution. These tools, representing modern cloud business intelligence, are hosted by a vendor and accessed through your web browser.
They offer lower upfront costs (usually a simple monthly subscription), effortless scalability, zero maintenance on your part, and the ability to access your data from anywhere.
Two names stand out in the commercial BI market – Microsoft Power BI and Tableau. When looking for the best bi tools, these are often at the top of the list.
Microsoft Power BI stands out as the top choice for MSMEs to get started. It’s easy to use (if you’re familiar with Excel or other Microsoft tools), fits right in with existing systems, and costs much less. Many businesses seek Power BI consulting to accelerate their setup.
Tableau is known for its top-notch data visuals and handles huge datasets well. But this power means it’s harder to learn and costs a lot more, making it a better fit for companies with their own data experts.
| Feature | Microsoft Power BI | Tableau | What’s best for MSMEs |
| Cost | Low (Starts at about $10/user/month) | High (Starts at about $75/user/month) | Power BI wins hands down on price. |
| Ease of Use | High (Simple, feels like Excel) | Medium (Steeper learning curve) | Power BI is faster and easier for non-technical teams to adopt. |
| Visualization | Very Good | Excellent | Tableau is superior for complex visuals, but Power BI is more than enough for most MSMEs. |
For businesses on a very tight budget, these open source BI tools offer a powerful, license-free alternative. The trade-off is that they require more technical know-how to set up and maintain.
The most beginner-friendly open-source option. Its intuitive interface lets non-technical users build dashboards without writing any code. An excellent starting point for exploring open source bi tools.
This platform has an extensive visualization library, though setting it up demands some technical know-how.
While not open-source, this tool is completely free and integrates perfectly with the Google ecosystem (Analytics, Sheets, Ads). It’s an incredibly powerful option if you’re already using Google’s services and can be considered a type of free business analytics software.
Putting BI into action doesn’t need to be a huge, scary undertaking. A successful business intelligence implementation follows a clear path. Use this straightforward, 10-step plan to move from data mess to clear insights without the stress.
Begin by pinpointing your most urgent business question. What key decision are you making without all the facts? Centre your first project on answering one question that will make a big difference.
As the owner, your dedication matters a lot. You need to lead the charge and lock down any budget you’ll need.
Bring in the people who will use the system (like your sales head or operations manager). This creates a sense of ownership and makes sure the solution meets real needs.
Look at your main goal and pick 3-5 KPIs to track success. Don’t go overboard; zero in on what helps you make choices.
Find out where your KPI info comes from and see if it’s good enough. Is it right and complete? This step matters.
Think about your money, what your team can do, and what you want to achieve, then choose a tool from the many business intelligence tools available. For most people, something online like Power BI or a free option like Looker Studio works well to start with.
This step matters most. Don’t attempt a full company rollout. Choose one issue to address first. A test that works well creates a strong internal example and builds drive.
Set up a basic dashboard with your test group. The aim isn’t to be perfect; it’s to adapt based on what users say.
Give practical, job-specific lessons. Help users feel confident with the tool, not scared of it.
After the test succeeds, grow to other parts of the company. BI involves ongoing learning and fine-tuning.
An experienced msme business coach can be an invaluable partner in navigating this transformation.
Getting the tool is easy. Making sure people adopt, trust, and use it to make smarter choices is what leads to success.
Here’s how you can steer clear of common traps.
The biggest threat to your BI project is bad data quality.
If your team spots mistakes in the dashboards, they’ll lose faith and go back to their old methods.
Best Practice To Avoid this-
A flawless dashboard that nobody touches is worthless.
Best Practice To Avoid this-
A successful pilot project is your best tool for showing, not telling, the value of BI. This is where ongoing business coaching and mentoring can help reinforce new habits and ensure the cultural shift sticks.
It’s tempting to cram every metric onto one screen, but this just creates a cluttered, confusing mess.
Best Practice To Avoid this-
Even small companies deal with sensitive information and need to be careful about security.
Best Practice To Avoid this-
Implementing Business Intelligence is a step toward building a more resilient, efficient, and competitive business.
The shift from disorganised spreadsheets and instinctive decisions to a culture of data-driven insight is now easier than ever. User-friendly, cloud business intelligence tools have levelled the playing field, putting powerful analytics within your reach.
For personalized guidance on this journey, many leaders find that one-on-one business coaching helps translate these technological capabilities into tangible business results.
Putting money into BI now isn’t just about tackling today’s problems. It’s about building a key skill for future expansion and becoming a smarter, more flexible company ready to excel in a world driven by data.
Don’t stop here and continue your learning journey with our related articles on leveraging data to boost your profits.
A BI Developer is a technical specialist who builds and maintains BI solutions.
For most MSMEs starting with a user-friendly tool like Power BI, you do not need to hire one. A tech-savvy employee or the owner can often handle the initial setup.
A BI Manager takes charge of a company’s overall BI game plan in bigger setups.
In smaller businesses, the owner wears this hat, pinpointing key questions and pushing for data use.
The price can vary from almost nothing to several thousand bucks a year. Using free tools like Looker Studio eliminates software costs.
A basic license for Power BI Pro is quite cheap. The main expense is often the hours your team spends on planning and getting up to speed.
For those needing expert guidance on strategy and implementation, working with a business coach for small businesses can maximize the return on this investment.
The biggest blunder is kicking off with the tech instead of focusing on the business issue. A close runner-up is overlooking data quality.
If you don’t set your goals first and make sure your data is trustworthy, your BI project is bound to flop.
With a well-defined pilot project, you can see tangible results (like time saved on manual reports) in a matter of weeks.
Bigger, more strategic insights, like spotting long-term customer patterns, will show up over a few months as you gather more data.